People Analytics demystified — Part 1: 12-month Trailing Averages
This is the first in a series of posts requested by clients on demystifying concepts in people analytics. It is intended to introduce analytical concepts to those without a mathematical or statistical background, in a way that is both intuitive and immediately useful. We hope it will lead to people asking more questions about analytics and pausing to consider implications of analyses they see in their day-to-day work.
If you want to get the entire series over the next few weeks comfortably in your inbox, sign up to our newsletter .
This week’s concept is 12-month Trailing Averages. Let’s jump right in.
12-month Trailing Averages
Say, you want to know if your company’s headcount has been growing over time. What’s the best way to present this figure?
You can look at the number of employees you have at the end of each month. Figure 1 is an example.
Figure 1: Monthly headcount
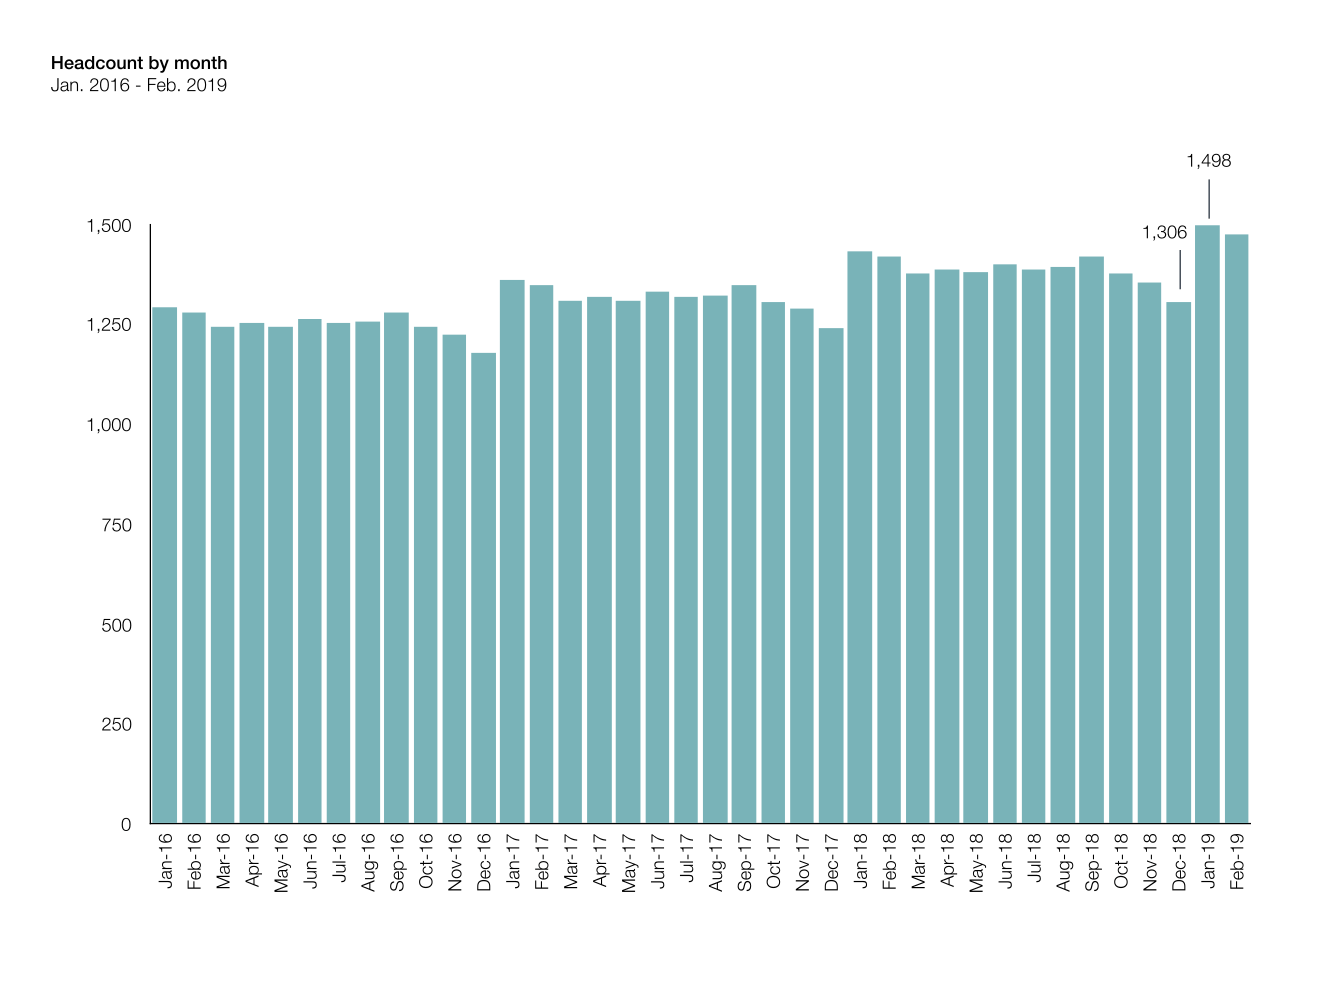
If you look at the number on Jan. 2019 (1,498), it is significantly higher than it was in Dec. 2018 (1,306). In fact, we can make the observation that Jan. of every year shows a higher number than the preceding Dec. This is likely due to the seasonality effect - people leave their work towards the end of the year, take some time for themselves over the holiday season, then begin a new job in the new year.
Given this pattern, it would be misleading to use monthly headcount figures to conclude if your company has been growing. If you reported the number in Jan., it would seem your company is growing; however, if you reported the Dec. number, it would seem your company is shrinking.
Since the seasonality effect is an annual one, one alternative is to report the average annual figure over 2018. This would take into account figures for a full season. While this would remove the seasonality effect, reporting annual averages would also mean you won’t get an update for a full 12 months.
What else could we do?
One answer is to use 12-month trailing averages.
Why are they called “trailing”? Picture a plane’s condensation trails — it trails the plane’s journey.
In keeping with this mental image, a “12-month trailing average” is the average of the previous 12 months. For example, Dec. 2018 is the average of Jan. 2018 to Dec. 2018. Jan. 2019 is the average of Feb. 2018 to Jan. 2019, etc.
Figure 2: How to calculate a 12-month trailing average
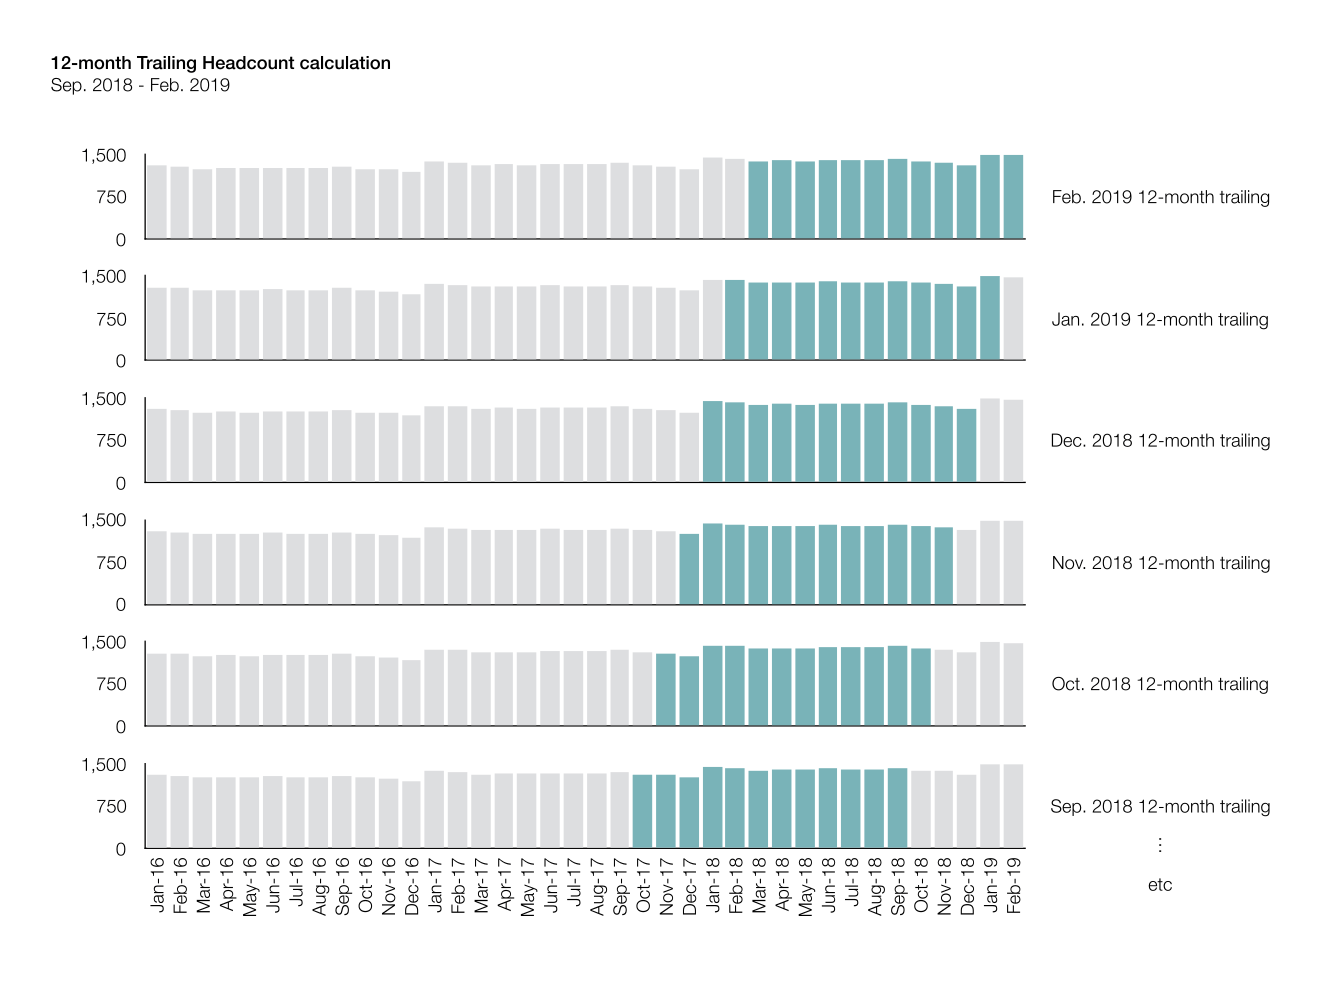
The 12-month trailing average figure for any given month takes into account a full year of data, removing the effect of seasonality, while still giving you monthly figures to act on any observed patterns. This is what a 12-month trailing monthly average of our data would look like:
Figure 3: Yearly trailing averages, calculated each month
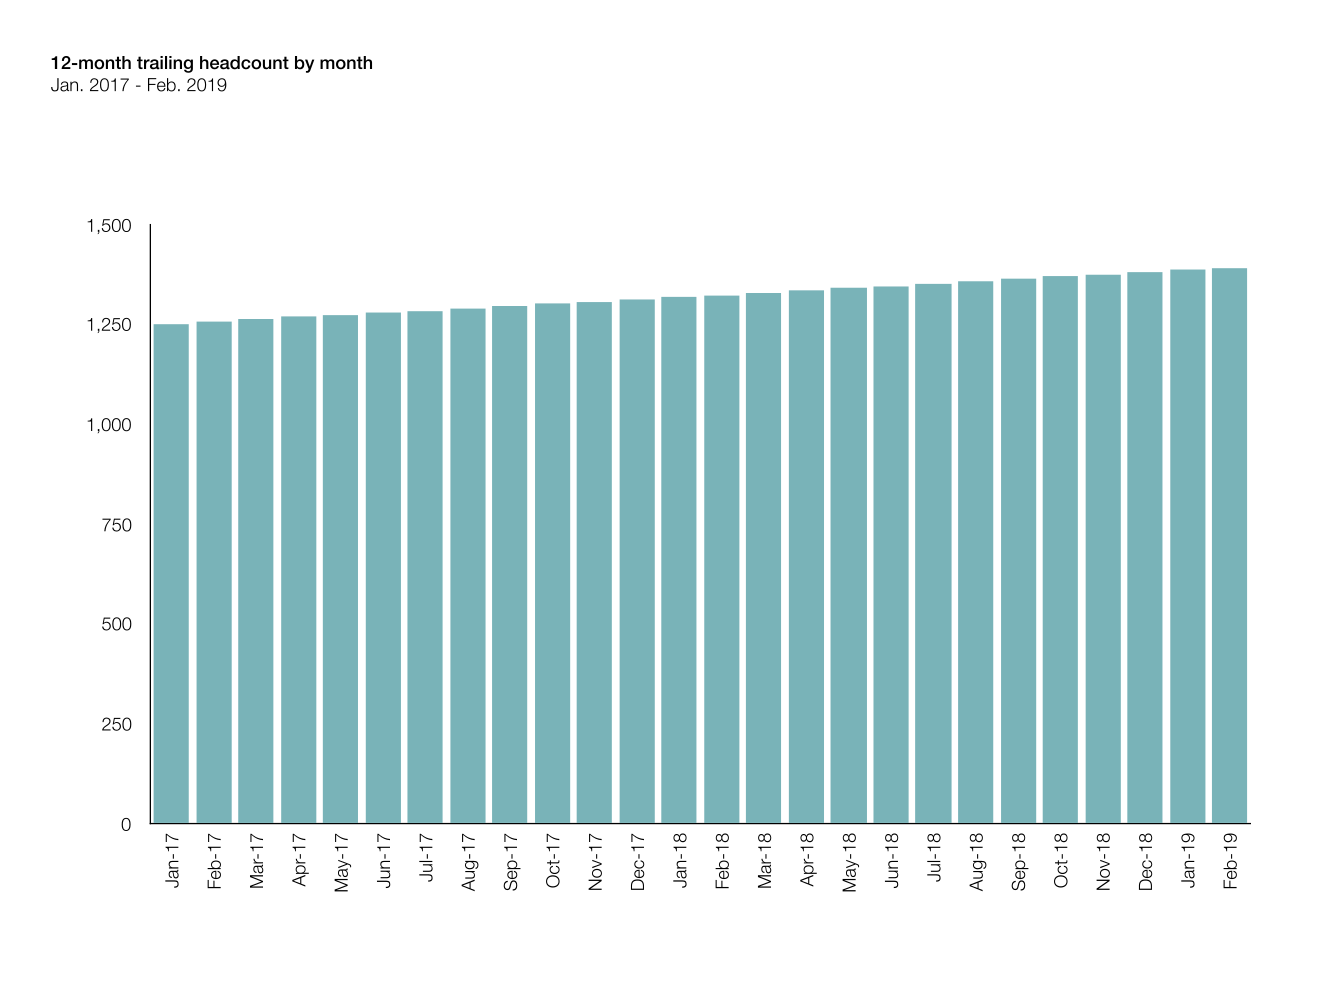
The company is consistently growing in headcount.
Conclusion
When you want to show monthly stats for a figure that is affected by seasonality, use 12-month trailing averages.
Sign up here to get notified when we publish a new post.
Subscribe to the latest data insights & blog updates
Fresh, original content for Law Firms and Legal Recruiters interested in data, diversity & inclusion, legal market insights, recruitment, and legal practice management.