How law firms can use Pirical On Demand to report diversity data: Survey Filler tutorial
Law firms are spending an increasing amount of time reporting their diversity data to clients and third parties including regulators. Learn how Survey Filler in Pirical On Demand (POD) can save you 90% of the time spent reporting diversity data.
What is it?
Survey Filler is a comprehensive and flexible table of your firm's diversity data, where you select what to populate the rows, columns & fields with. Easily access all the data you need in one place, apply a wide range of metrics and extract it at the click of a button.
Already a POD customer? Check out Survey Filler now.
What you can view
With Survey Filler you can combine a number of different data points to view granular diversity information about your firm. See demographic data across various metrics, role information, client work, location and more. Grab the absolute and percentage % figures for all key diversity traits, allowing you to answer any specific diversity related questions that come your way.
View your firm's diversity data by...
Diversity trait
Gender, ethnicity, sexual orientation, socioeconomic background and disability.
Headcount
View the overall demographic figures at your firm; apply the distinct headcount, headcount at start & end of period, average headcount and average FTE metrics.
Career progression
See the diversity breakdown of how staff are progressing in the firm; apply the hires, terminations and partner promotions metrics.
Utilization
Analyze diversity data against how staff at the firm are utilized; apply the hours worked metric.
Financial
See how different groups at the firm are performing from a financial perspective; apply the achieved revenue and discounts and write-offs metrics.
Client work
View the diversity data of staff that worked for specific clients and on specific matters.
Role information & location
Look at demographic info by role, department, employee category, division, office and region.
Pre-populated templates
Survey Filler contains pre-populated templates for the most common legal industry surveys.
Select a template and view your firm's data in the exact format needed for the diversity survey in question. Easily copy and paste the results directly into the survey in just a few clicks.
Templates include:
- Minority Corporate Counsel Association (MCCA) Law Firm Diversity Survey
- American Bar Association (ABA) Model Diversity Survey
- General Counsel for Diversity & Inclusion questionnaire
- Law.com International UK Diversity Survey
How to view different data points
On the right hand panel under Filters, you can select to view different data points from a series of drop down lists. The table automatically updates after each selection.
Under Metric you select which of the metrics listed above you'd like to look at; headcount, career progression, utilization or financial related.
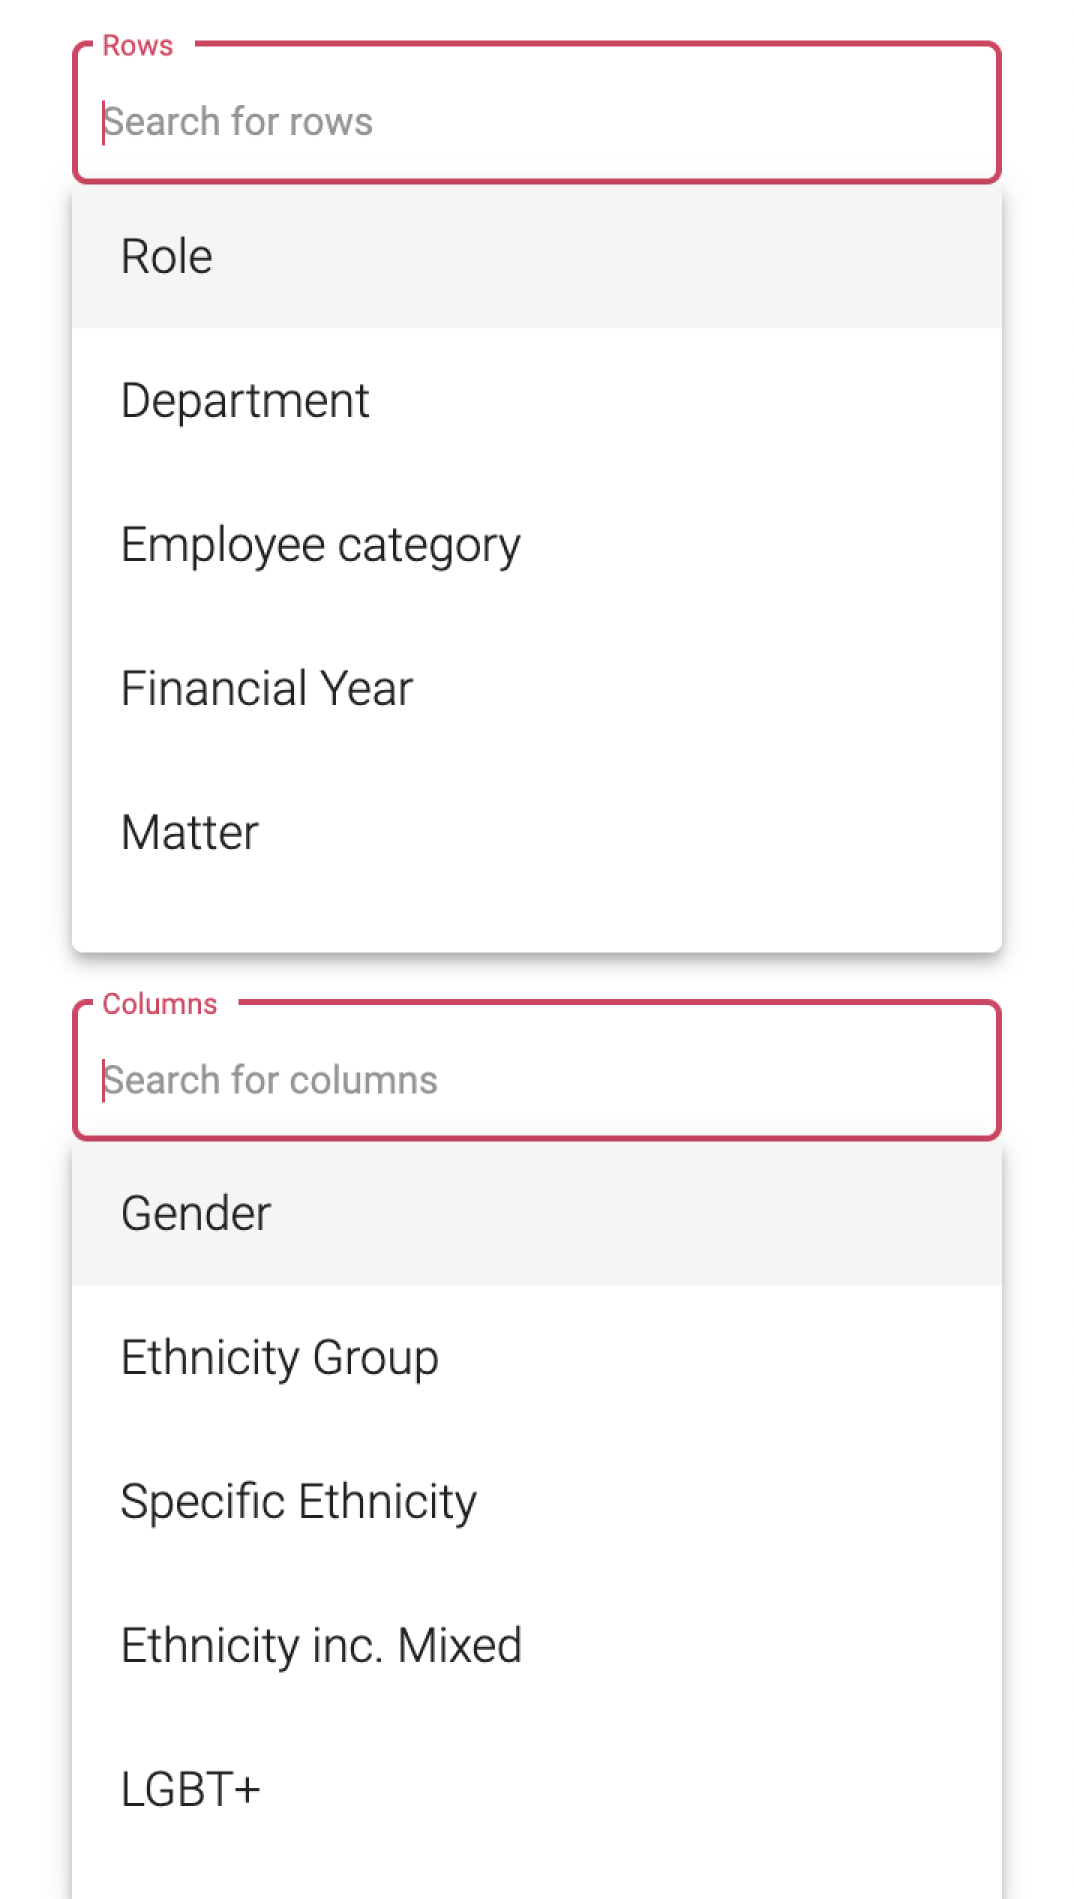
Choose which data points to populate the table with from Rows and Columns, select various diversity traits and role information such as:
- Role
- Department
- Employee category
- Gender
- Ethnicity
- LGBT+
- Socioeconomic background

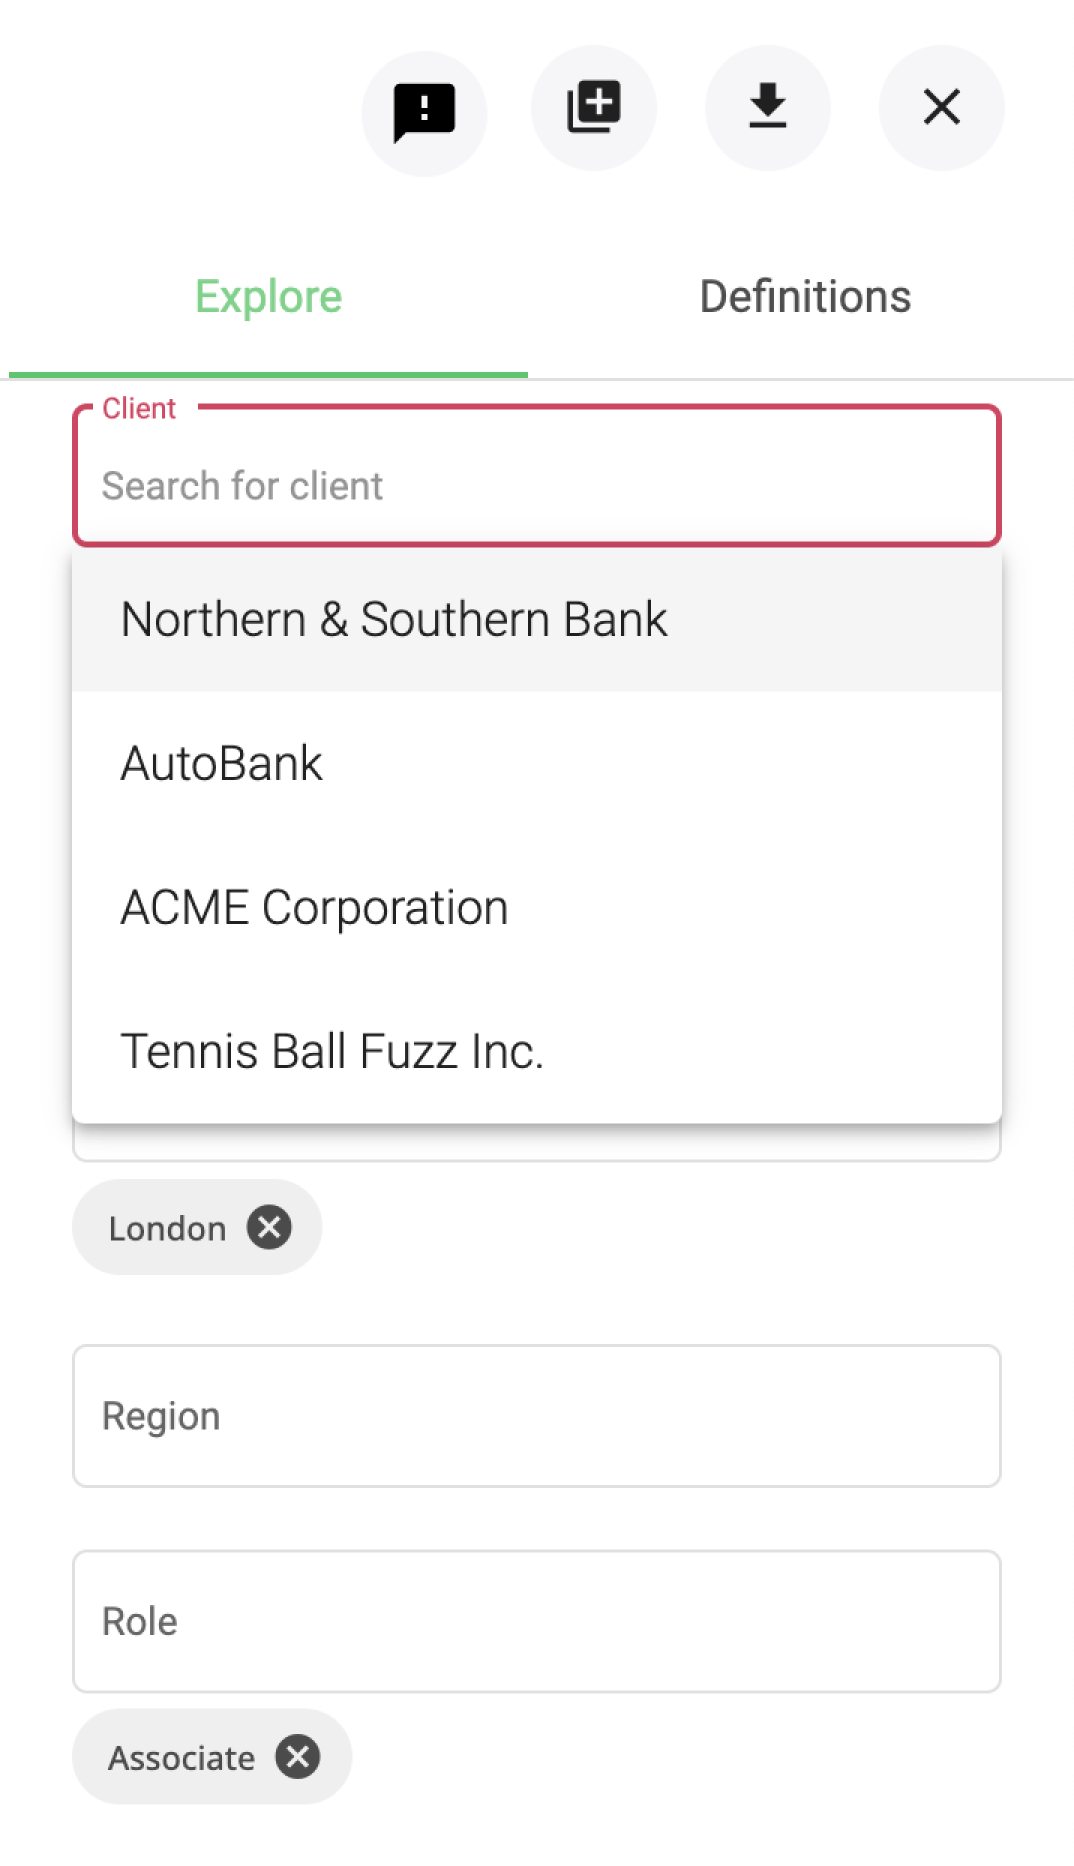
Under Client and Matter you can choose to look at data for staff that worked for specific clients and on specific client matters.
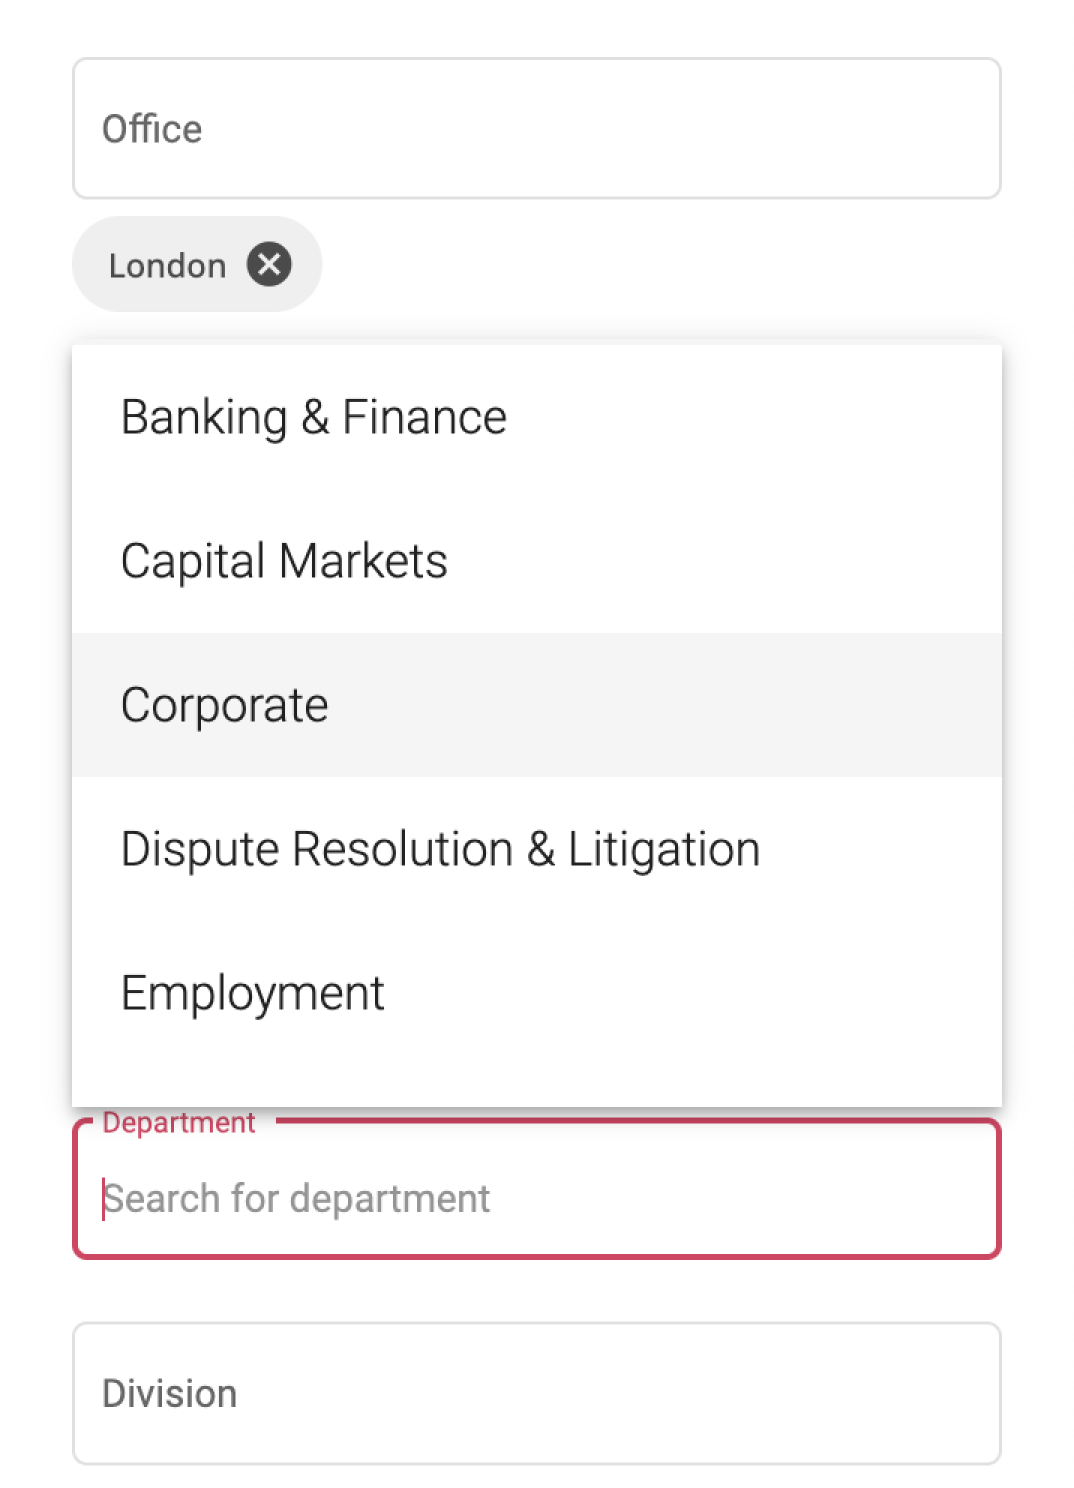
The rest of the filter options include
Employment status,
Office,
Region,
Role,
Employee category,
Department and
Division.
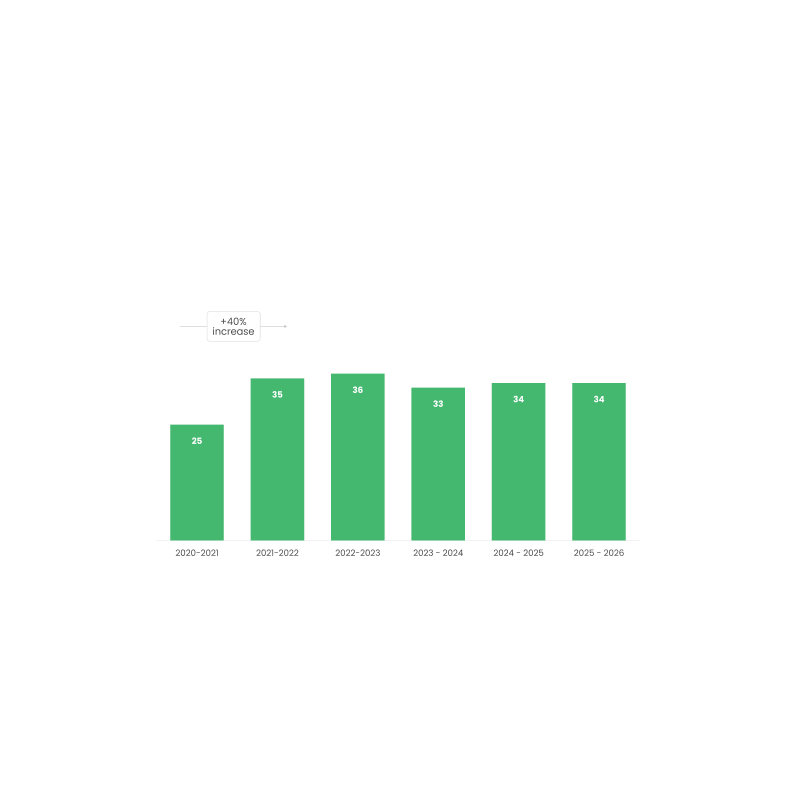
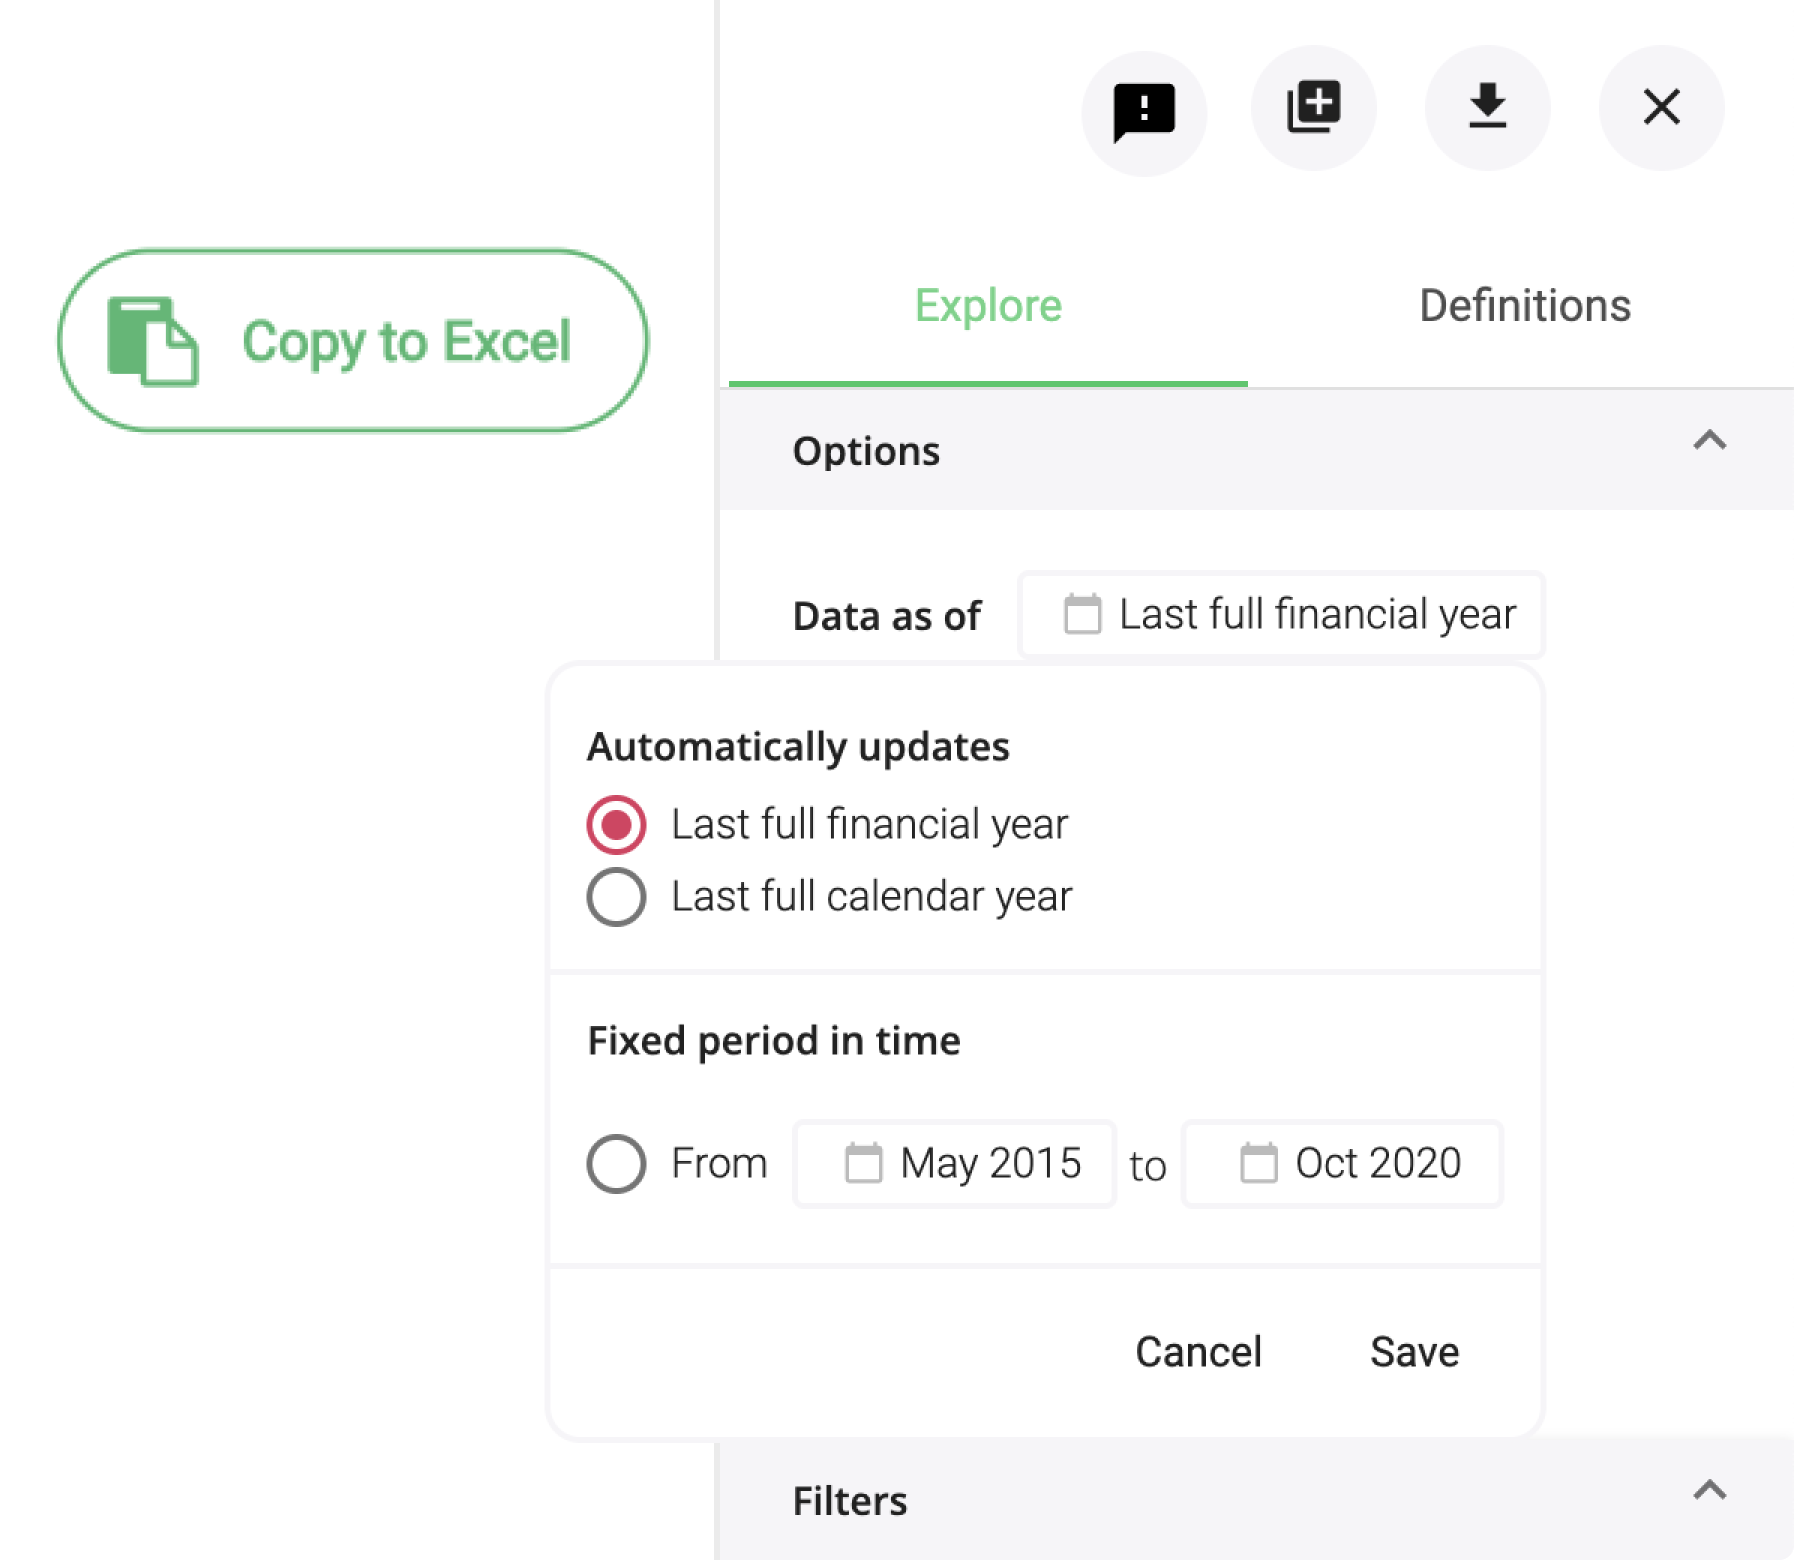
Adjust the timeframe for your data under Options in the right hand panel. Choose between financial year, calendar year or a custom timeframe.
Easily export any data set with the
Copy to Excel button on the right hand side of the screen.
What is Pirical On Demand (POD)?
Pirical's people analytics software equips law firms with the HR, rewards and diversity data they need to make smarter and fairer people decisions.
HR data is messy, hard to analyze and difficult to distribute to people leaders. With Pirical On Demand, it's a lot easier for people leaders to get value out of it, without the need for an army of analysts and engineers. With Pirical, you can save time, get people engaged and take a more sophisticated, data-driven approach.
Stay up-to-date with the latest market insights and law firm rankings
Subscribe to email updates
Subscribe to content