How To Set Diversity Goals From Data
Pirical on Demand can give you the data and corresponding actions to set and achieve your firm's diversity goals. Some firms will call these 'targets'.
The most common target set by law firms is for partner representation
Unless you have a specific population in mind, Pirical recommends that diversity targets focus on partner representation. It is commonly an area of underrepresentation and encourages attention on the performance of your entire pipeline to partnership.
Furthermore, we recommend that the targets are set for 3 to 5 years’ time. This is enough time to effect change and for the current leadership to see change.
Set diversity targets with a bottom-up approach
↓ Top-Down Approach
Set targets for the firm and then push the targets down regardless of individual practice groups’ constraints.
This method is a one-size-fits-all approach. Some practice groups benefit, others are disadvantaged.
The firmwide target of 50% female partnership by 2033 is applied unilaterally to every practice group.
Practice group 1: We are already above that target. Practice group 2: We will not be able to reach that target by 2033, maybe if there was more time we could. Practice group 3: This target is totally unrealistic for our practice group and we cannot achieve it.
↑ Bottom-Up Approach
Set targets for each practice group and then aggregate them up for the firm.
This method allows for personalisation of goals and for reality to be included in the plan when it is made. This makes the ultimate goals of the plan easier to achieve. Pirical on Demand enables you to analyse practice-specific targets which ultimately lead to a firmwide aggregate.
Practice group 1: We can hit 55% female partnership by 2033 if we do X and Z.
Practice group 2: We can hit 49% female partnership by 2033 if we do Z.
Practice group 3: We can hit 47% female partnership by 2033 if we do X, Y and Z.
If the practices achieve their individual plans, the firm can expect to hit 50% female partnership by 2033.
Using Pirical on Demand to Set Diversity Targets
This bottom-up method of setting diversity targets uses a spreadsheet and Pirical on Demand data to fill it out.
Step 1
The first step is to define the current practice group partner populations by gender.
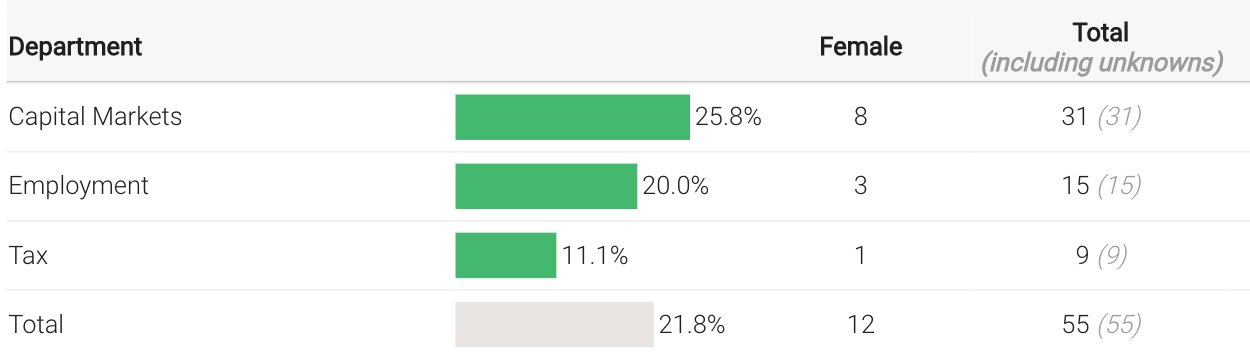
To help keep track of all the numbers, you will find it helpful to set up a spreadsheet like this one.

Smaller practices may present a challenge: the target-setting process works better with large enough population sizes. Pirical recommends grouping them together into an 'Other' row.
Step 2
This step uses Pirical on Demand projections. There are 4 different scenarios plotted on this graph. Each scenario focuses on a different lever that affects the % of female partners over the next 10 years.
This graph shows the various projections for the Tax Practice
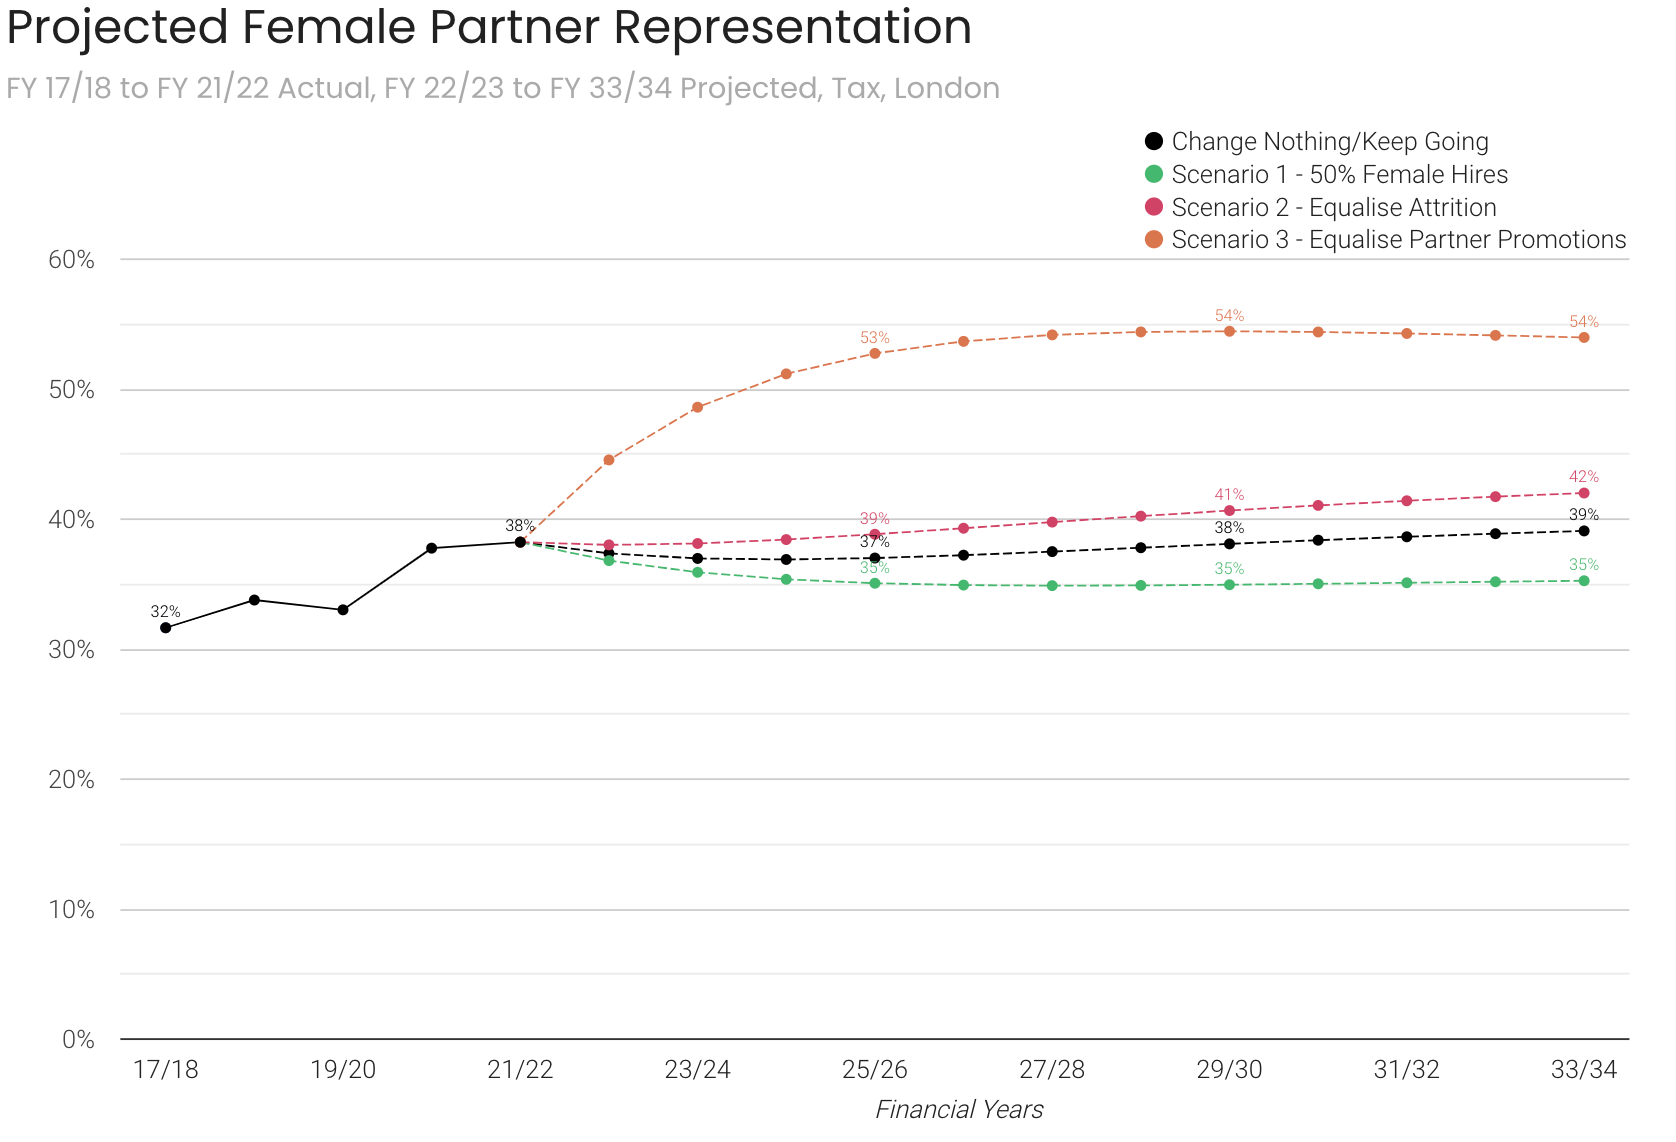
This information needs to be added to the spreadsheet. There are two columns that need to be added. The first column is the scenario in black; change nothing/keep going, also called the 'Baseline'. The information for the Employment and Capital Market practice groups was taken from their projections.

The second column will be a combination of all the scenarios depicted which will be a stretch target. This target is calculated automatically in POD as the 'Combined Case', example:
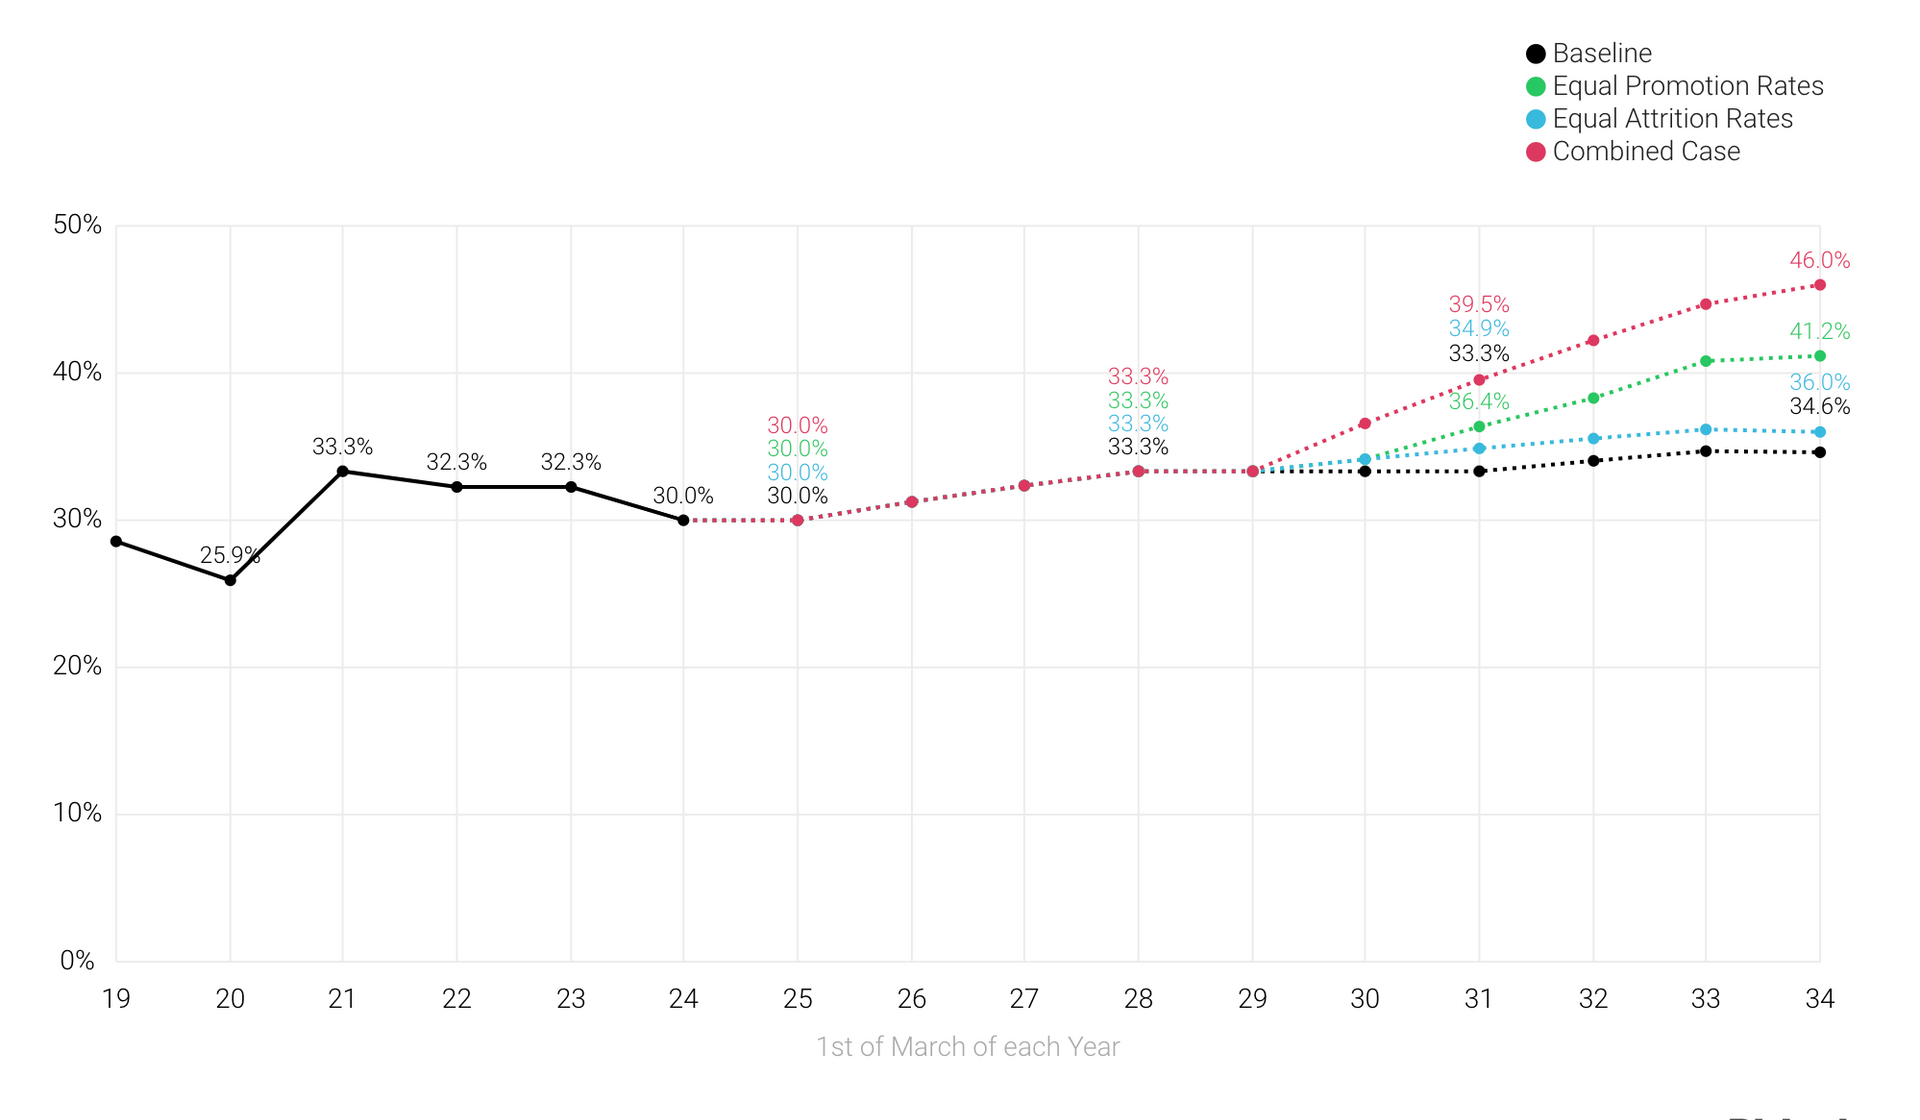
Add this stretch target to your sheet as another column:

Step 3
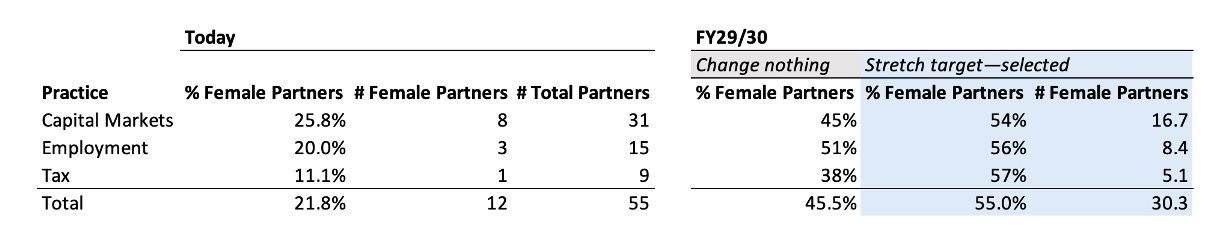
This step is aggregating the individual practice’s targets to produce a firmwide target. This is calculated as a weighted average. Taking the Employment row as an example, if the target was 56%, the number of female partners is 8.4 (56% x 15). The last column was worked out this way for each practice. The firmwide target is 55%, worked out by taking the total number of female partners/total number of partners (30.3/55).
Next Steps: Present and get buy-in
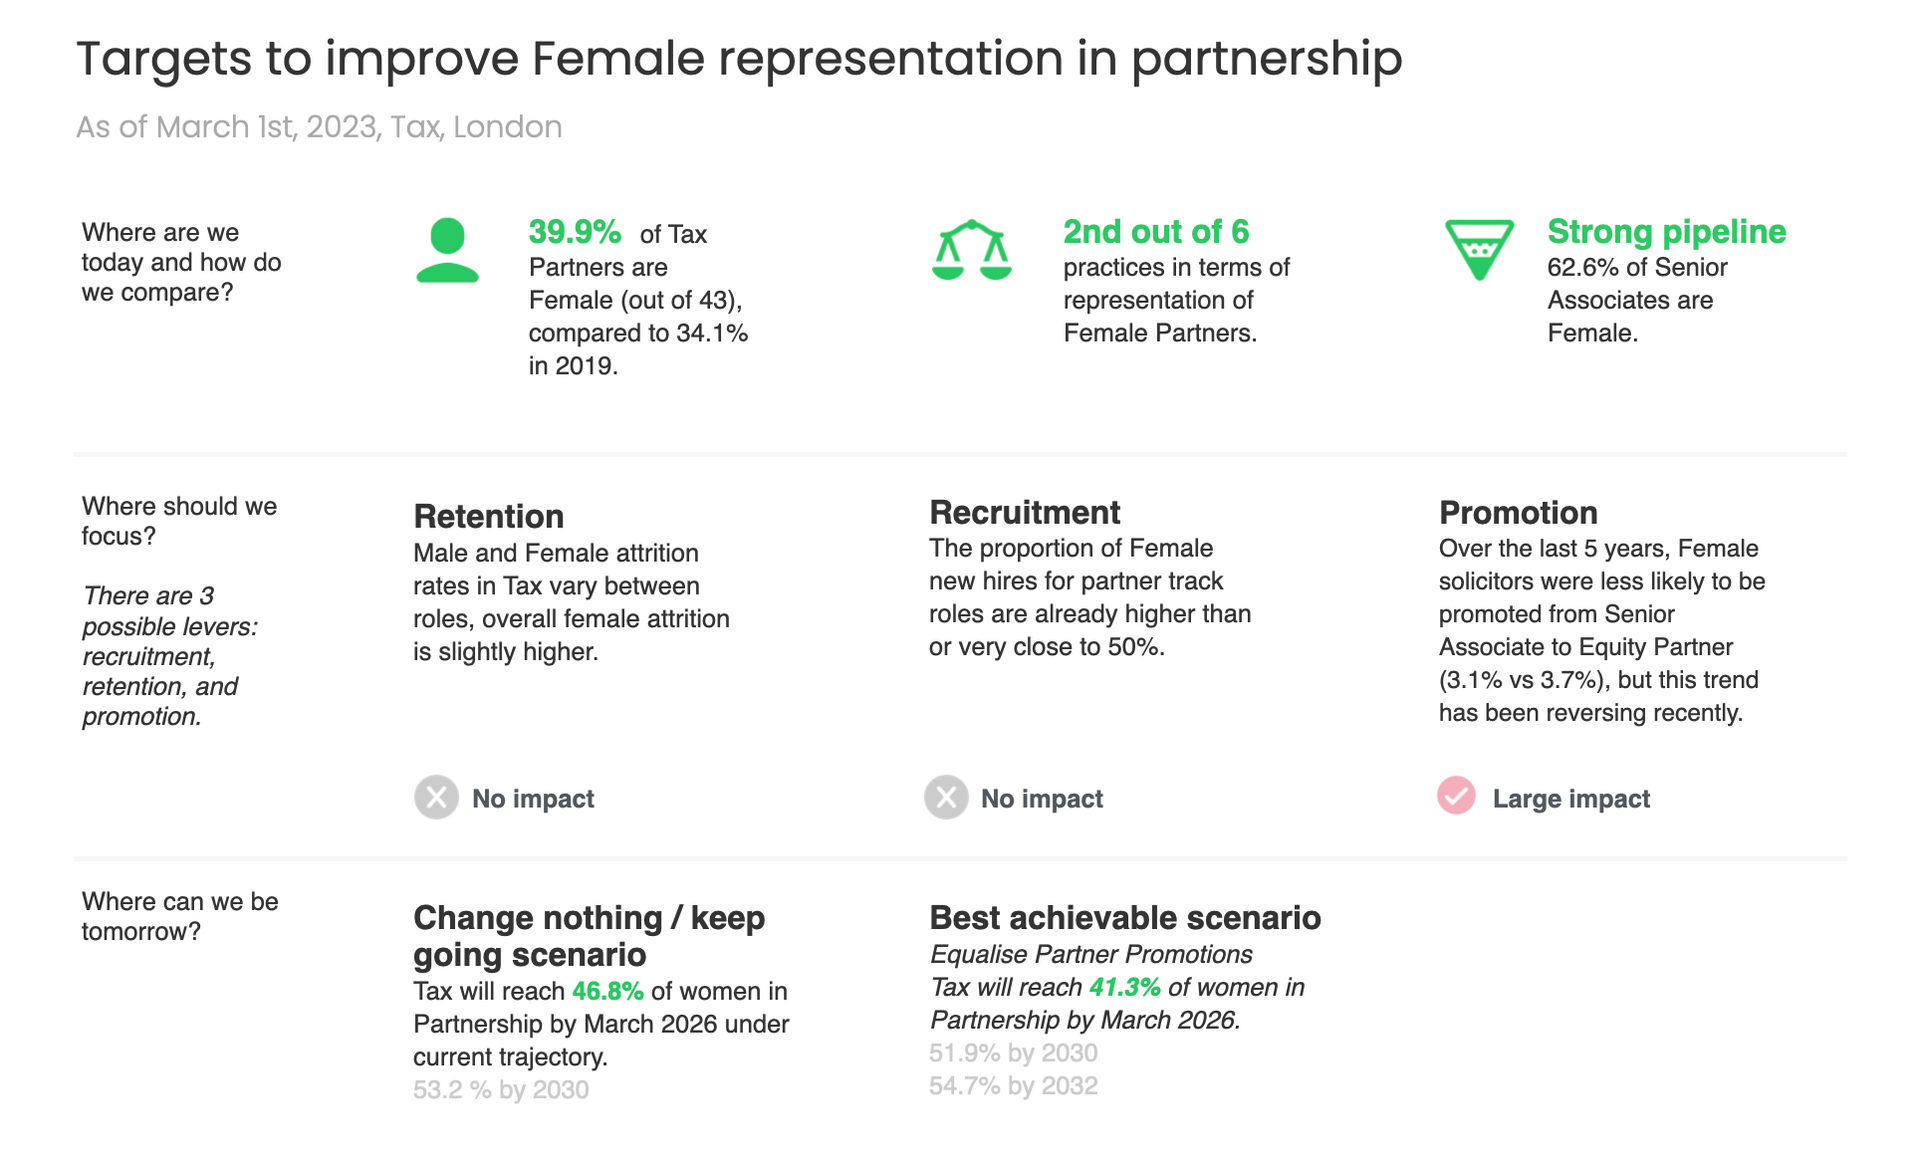
An important part of setting diversity targets is getting the buy-in from everyone at the firm. Presenting the spreadsheet above might not be the most persuasive way to do this. A simplified version with the key facts and figures that make up this spreadsheet will be easier to understand and digest.
This is an example of a slide that was put together using a spreadsheet like the one above. It is broken down to show the present position of a tax practice, the future position and how the practice can get there. It is to the point and only focuses on the key highlights. If you wanted to supplement each statement with evidence, you could add links to each that make use of the charts and graphs behind the numbers.
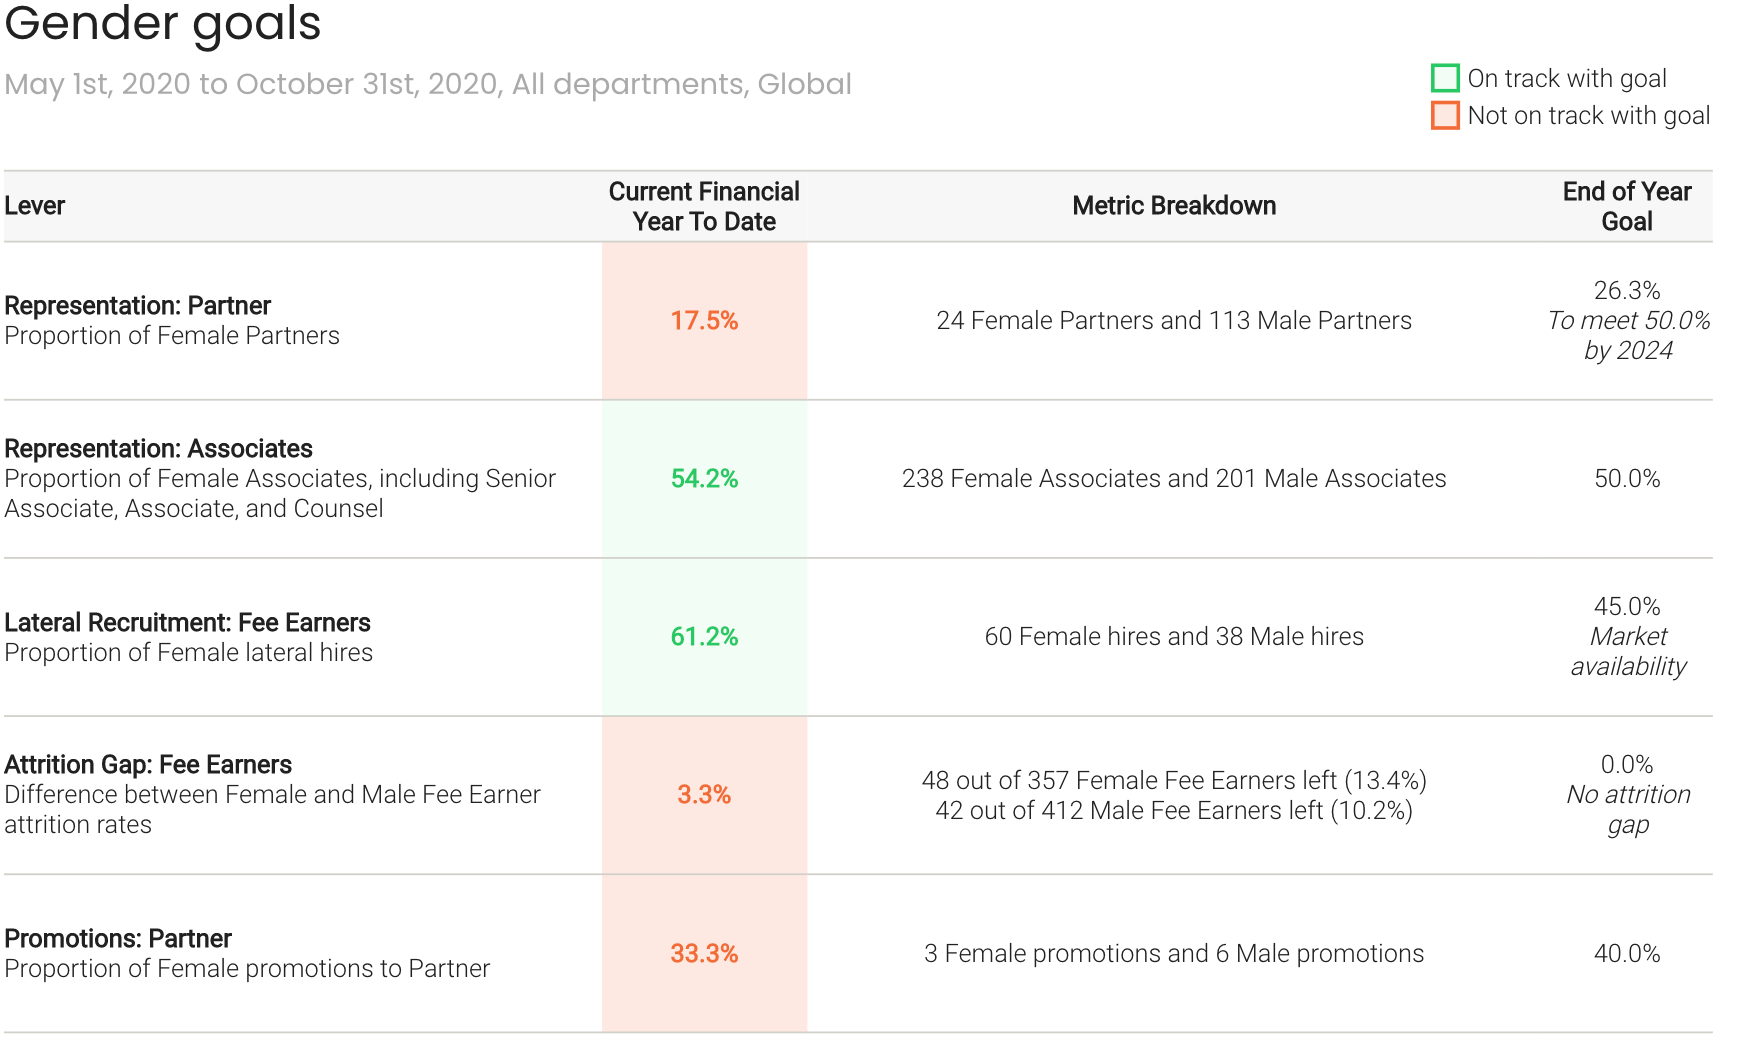
Next Steps: Monitor progress against targets
Pirical on Demand has a screen that can help you monitor the progress of each target. The information on this screen will be updated monthly. This gives you ownership of the goal. These goals can be set up by Pirical once you have decided what they should be for your firm.
Stay up-to-date with the latest market insights and law firm rankings
Subscribe to email updates
Subscribe to content